
Mission & impact
The Welfare Footprint Institute is a research organization dedicated to an audacious but concrete goal: quantifying animal welfare impacts to inform practice, policy, investing and purchasing decisions.
We quantify welfare using a biologically meaningful, relatable and comparable metric: time in affective states (negative or positive) of different intensities—a metric applicable across farming systems, geographies and species.
We partner with all stakeholders across animal supply chains—academics, producers, policymakers, animal protection organizations, investors and certifiers—maintaining scientific rigor and independence, and bringing transparency to animal welfare impacts through evidence-based measurement, peer review, and full disclosure of assumptions and uncertainties.
We act as a multiplier of impact, making animal welfare efforts more effective through objective measurement that all stakeholders can rely on.
Mission: To advance the scientific quantification of animal welfare to drive improvements in policy, practice, and ethical decision-making.
What WFI is
WFI develops and stewards the scientific infrastructure that makes animal welfare measurable. Through the Welfare Footprint Framework (WFF), it provides the methodology, standards and analytical tools needed to quantify animals’ lived affective experiences: the time they spend in negative and positive states of different intensities, under defined circumstances, with explicit assumptions and uncertainty. By making welfare quantifiable, comparable and auditable, WFI enables animal welfare to be considered alongside other quantities that routinely shape decisions, such as price, health outcomes, environmental impact and risk.
What WFI is not
- Not an advocacy organization. WFI produces evidence, metrics and transparent assumptions. It does not issue institutional moral verdicts about what people, companies or policymakers must do.
- Not a certifier of products or production systems. WFI does not certify products or production systems, or prescribe their welfare standards. It develops the scientific methods and metrics that others may use. (This is distinct from practitioner certification. Certification is planned for 2027.)
- Not a general consultancy. WFI takes on advisory work selectively, only where it advances the development, application or dissemination of the WFF.
- Not a decision-maker. WFI measures and quantifies welfare impacts. How those impacts are weighed against other considerations is for the people who use them.
Closest analogues: the GHG Protocol (for carbon accounting) and the Global Burden of Disease study (for health metrics): independent scientific infrastructure that others build on and apply.
Four impact mechanisms
Welfare footprint metrics create positive impact through four mechanisms.
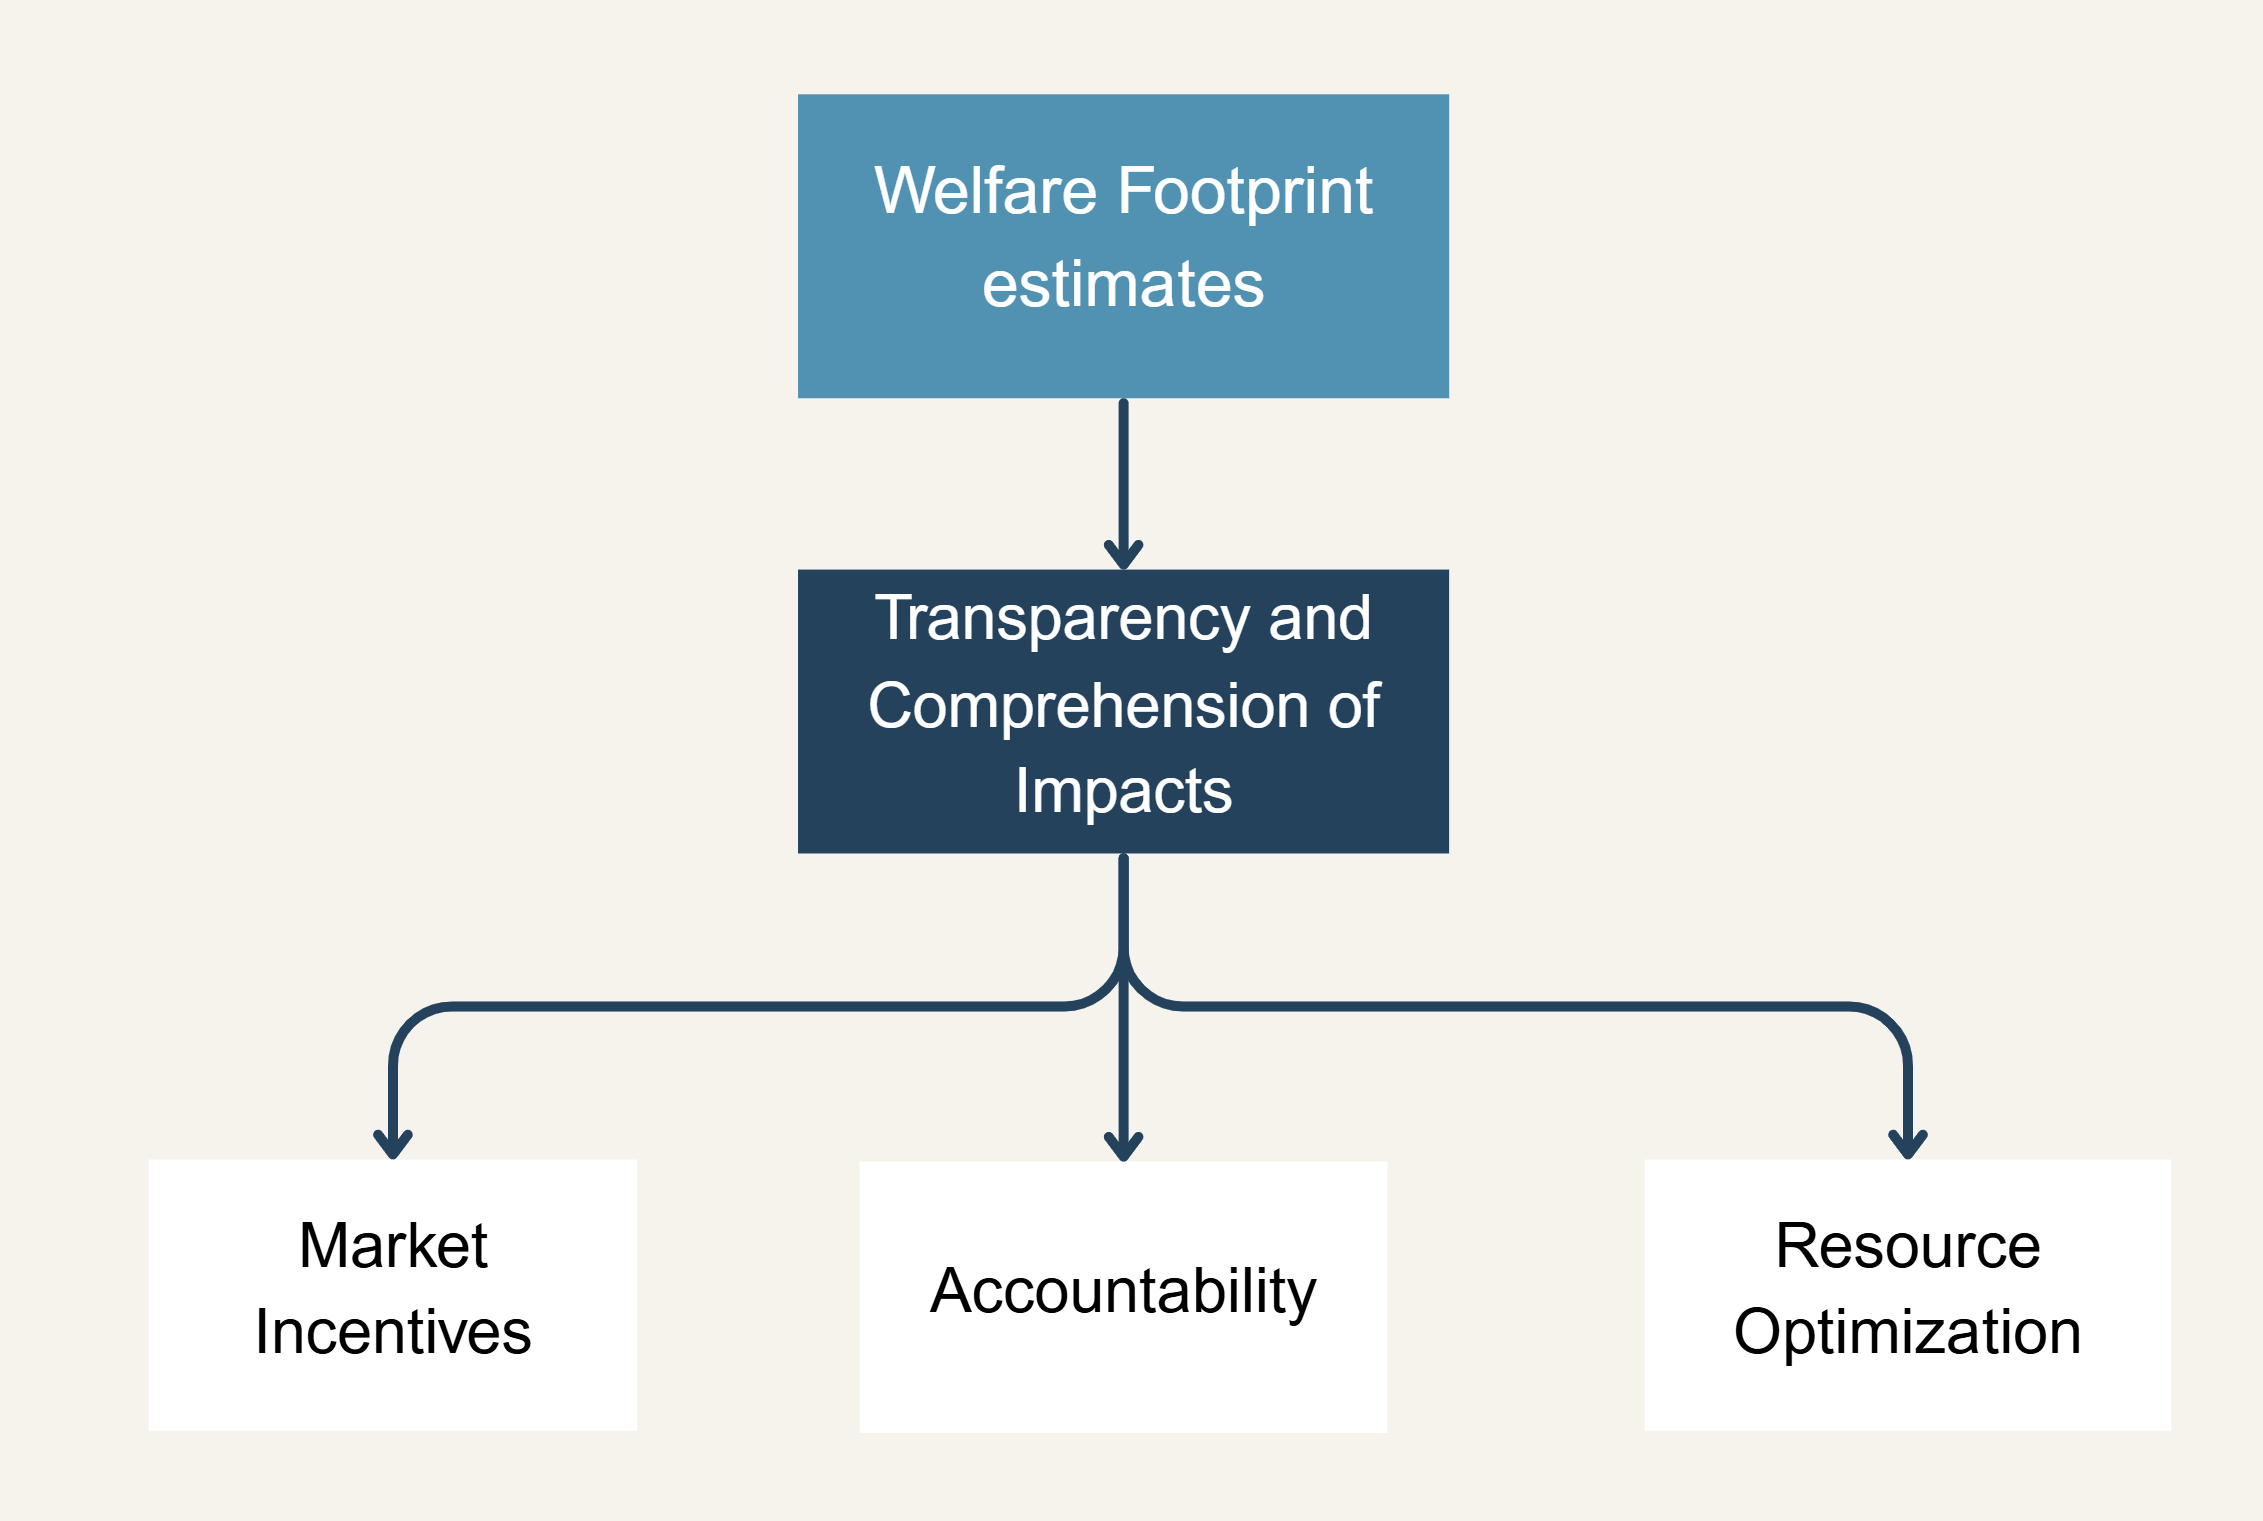
Transparency
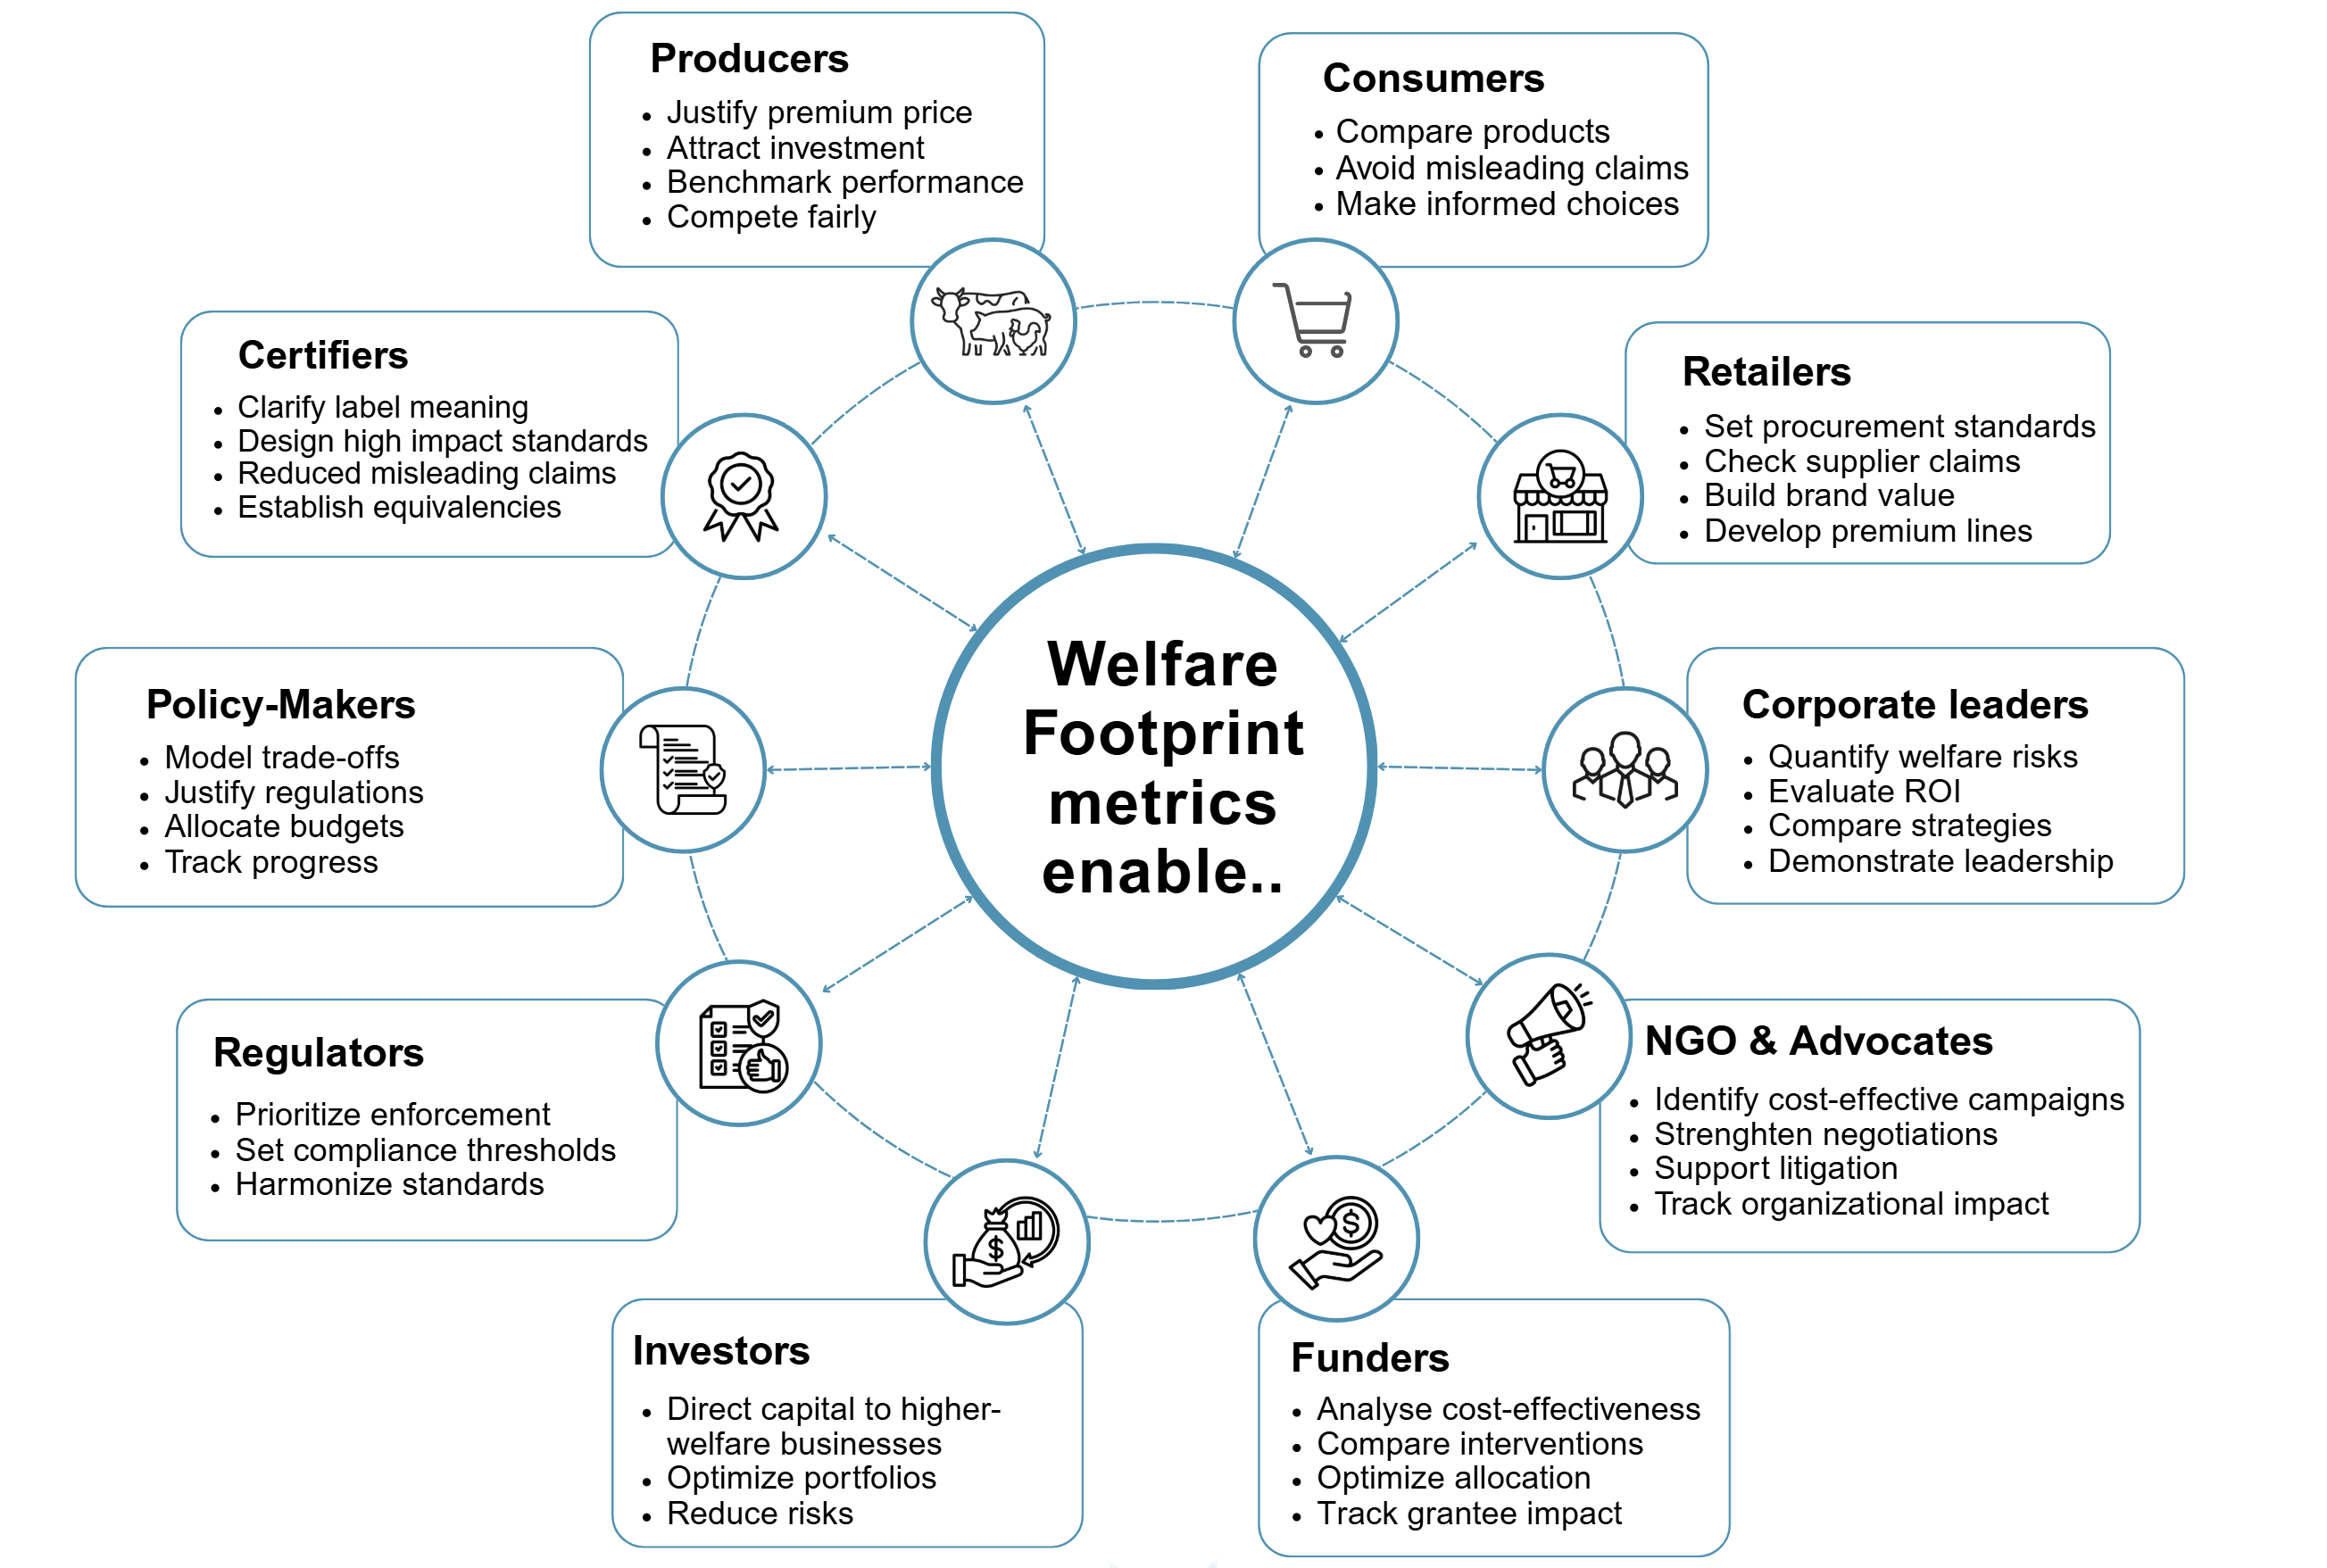
Making animal welfare impacts visible, understandable and measurable. When welfare is quantified in relatable units like "hours of intense pain per kg or $" stakeholders can finally see and compare the true costs.
Market incentives
Creating incentives that reward true welfare improvements while reducing the power of misleading claims. Producers who invest in welfare can justify premium pricing with concrete evidence.
Accountability
Enabling verification, monitoring, and evaluation of welfare claims and commitments. Certifiers, retailers, and regulators can verify the extent to which standards actually reduce animal pain and improve welfare.
Resource optimization
Directing limited funds, research, and efforts to highest-impact interventions. Organizations can identify which campaigns prevent the most animal pain, or improve welfare the most, per dollar spent.
How transparency drives positive change to animals
Pathway to positive impact
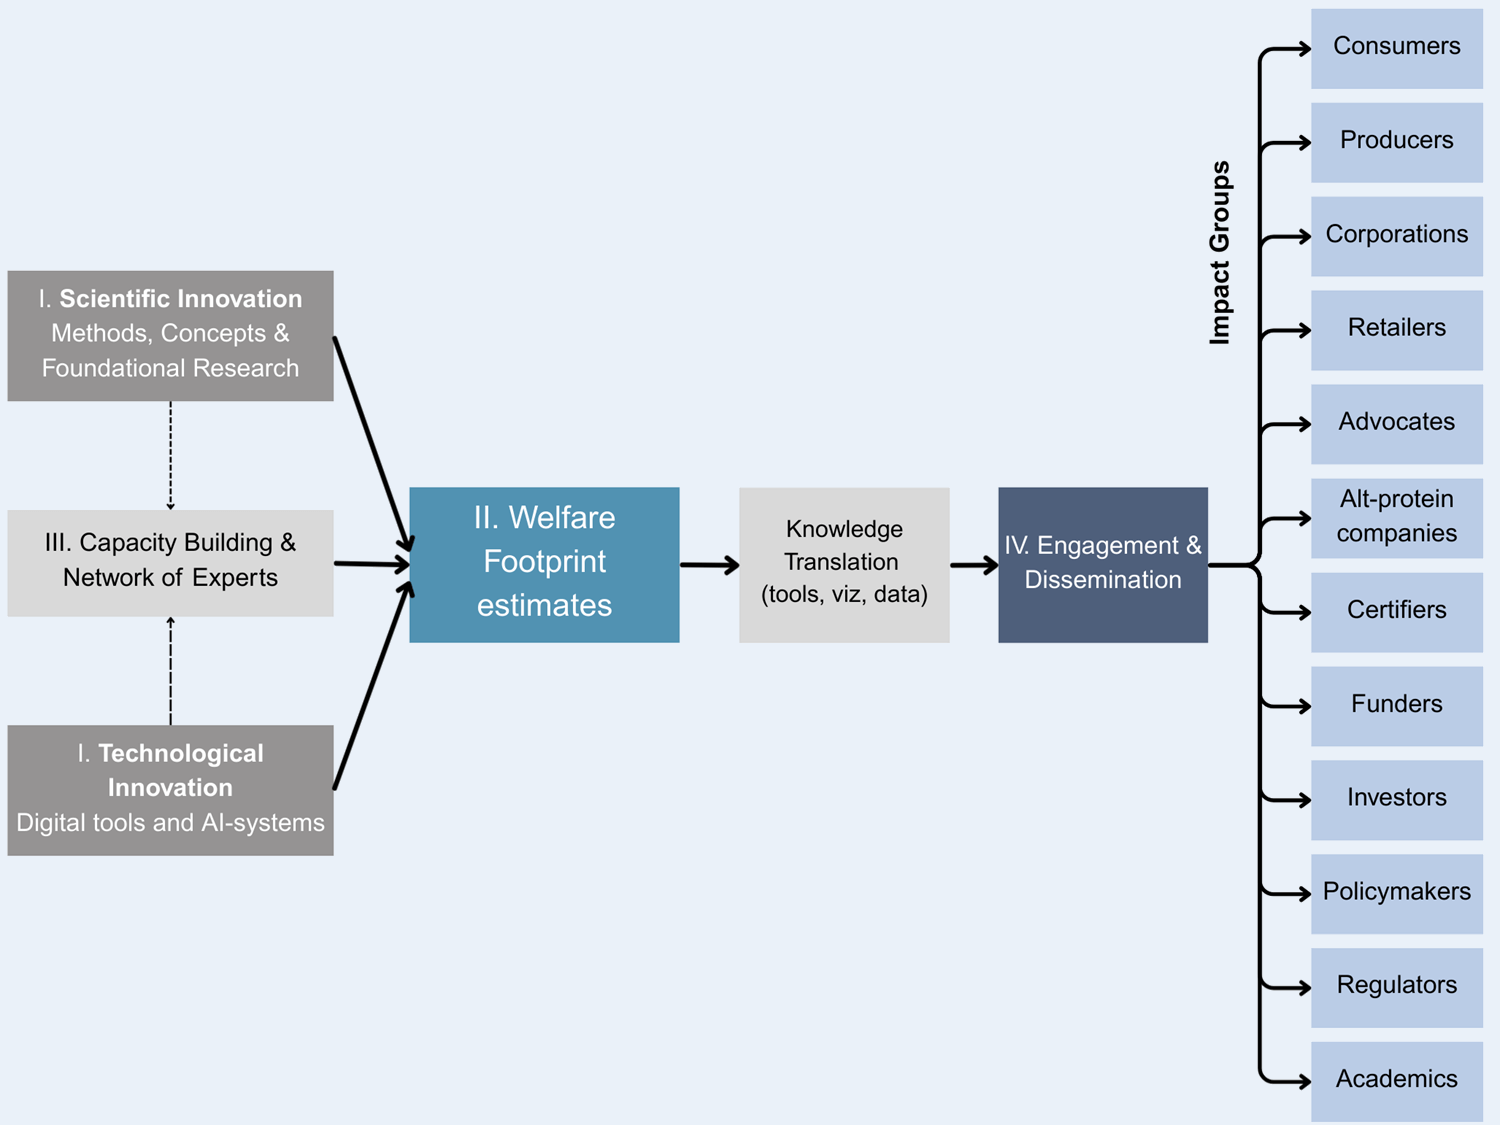
I. Scientific & Tech Innovation
- Development: new concepts & metrics
- The Welfare Footprint Atlas and other digital and AI tools to accelerate research
II. Applied: Welfare Impact Estimates
- Production of welfare impact estimates
- Identification of effective approaches
- Identification of key research gaps
III. Capacity Building & Network Growth
- Training and certification programs
- Academic partnerships
IV. Engagement & Dissemination
- Partnering with certifiers and producers
- Tools for policymakers and regulators
- Clear communication for consumers
- Evidence for animal protection NGOs
Growing impact
Some changes go beyond incremental improvement, creating ripple effects. Welfare Footprints follow this pattern, enabling animal welfare to be integrated into economic, policy, and consumer decisions in ways that can drive systemic improvements. Importantly, the value of estimates grows disproportionately as their coverage includes a broader range of products and farming practices, by enhancing the comparability of previously existing estimates and unlocking applications in new sectors.
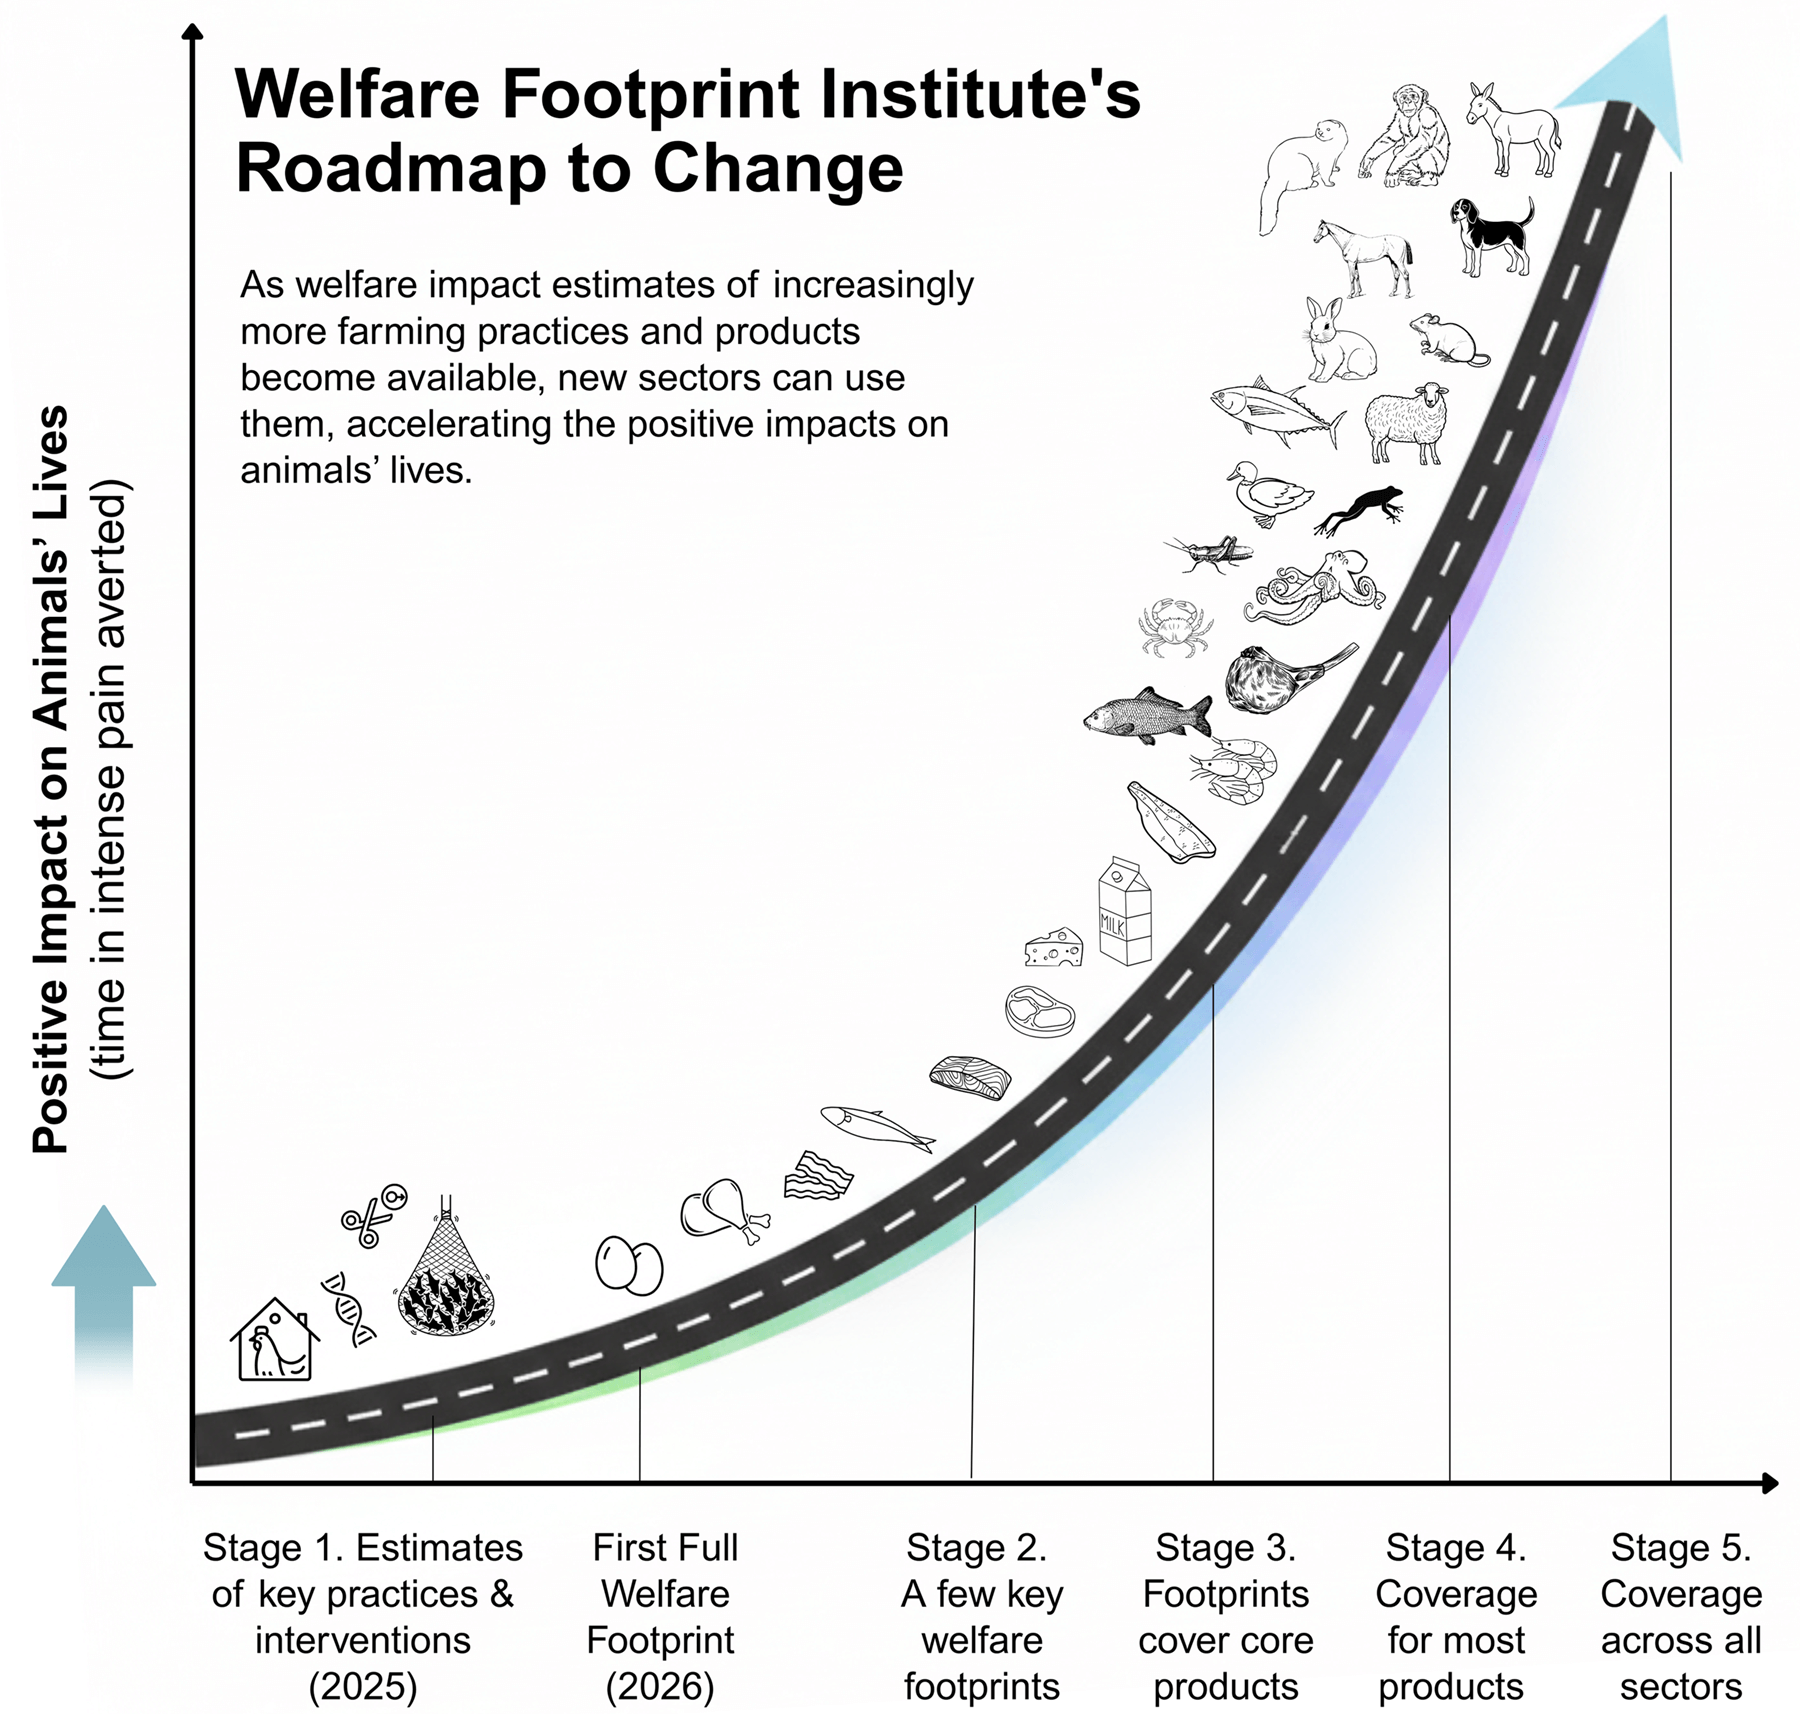
Building the science and community
Establishing the Welfare Footprint Framework’s scientific foundations, and the infrastructure, partnerships and community needed for its broader use.
Scaling adoption
Researchers, practitioners, educators, companies and policymakers apply, test, improve and teach the framework independently, with WFI as its scientific steward.
Changing decisions
Animal welfare becomes a routine part of research, funding, certification, procurement and policy decisions, considered alongside health, environmental and economic effects.
Changing outcomes
Lasting improvements in animals’ lives through better-informed decisions.
These horizons describe the direction of WFI’s work, not a timetable.
WFI in numbers
Academic network
- researchers using the WFF
- from 50 universities & institutions
- and over 20 countries
Public engagement
- global audience reached (millions)
- 100+ media outlets citing WFI work
- 21+ countries with media coverage
WFI's impact estimates
- affective experiences investigated and quantified
- 30+ interventions to be assessed by 2028
- 5 animal groups covered
Governmental adoption
- agencies using estimates or WFF
- 2 regulatory bodies trained for use
- 1 multinational agency citing
Industry adoption
- farms in analytical scope covered
- included in the 30+ interventions to be assessed by 2028
- 4 countries covered
NGO adoption
- organizations using WF estimates
- 10+ in cost-effectiveness calculations
- 5+ funders using for decision-making
Cost-effectiveness
WFI’s metrics support improvements in animal welfare by enabling evidence-based decisions across diverse stakeholders. The cost-effectiveness of WFI’s work arises mainly from leverage: the metrics can help existing investments in activities that affect animals—by companies, governments, funders and researchers—achieve more for animals, by allowing resources to be allocated more effectively and welfare impacts to be compared. Examples of where the metrics can be used.
- Industry Practices: lets companies compare the welfare impacts of reforms, facility upgrades or supply-chain changes, and the welfare improvement achieved per dollar spent.
- Public Policy: lets policymakers compare the welfare impacts of policy options in impact assessments, alongside cost, health and environmental effects.
- Research Prioritization: helps research funders identify, and direct funding towards, the welfare issues with the greatest time in intense pain.
- Philanthropic Allocation: lets foundations and other funders compare interventions by the welfare improvement they achieve per dollar, based on evidence.
- Market and Consumer Decisions: gives certifiers, retailers and consumers a common measure for checking how far welfare claims and labels correspond to measured welfare outcomes.
Cost-effectiveness calculator
The Cost-Effectiveness Calculator is an illustrative tool. It shows how the additional welfare improvement attributable to a welfare research study can be estimated: you enter your own assumptions about the animal population in scope, the time in pain a welfare change would avert, how much credible evidence increases the change’s uptake, and the study’s cost, and the calculator returns the additional hours of pain averted per dollar under those assumptions. Results follow directly from the values entered and are not estimates of WFI’s impact.
Example of hypothetical broad-scale welfare impact
Consider the population of over 200 billion farmed vertebrates slaughtered every year, and the potential to improve the lives of, say, 5% of this population (~10 billion animals, mostly broilers and fish) globally (this is based on one of the major global campaigns, the cage-free transition, reaching about 5 to 20% of the global population; we assume campaigns reaching broilers and fish will be relatively less successful). We assume each broiler chicken experiences > 50 hours of intense pain (as previously estimated), and farmed fish live ~20 months in captivity. If only 1% of farmed fish lifespan was in intense pain (a conservative assumption), this would amount to about 100 hours in intense pain per fish (20 months x 30 days x 16 hours/day * 0.01). If by helping design more effective interventions, standards and practices to reduce time suffering, the WFI made welfare interventions just 1% more effective than they would have been otherwise (counterfactual), either by helping reduce more time in pain or increasing the likelihood of implementation, it could help avert an ‘additional’ 8 billion hours in intense pain per year. This represents >5,000 hours in intense pain averted per dollar every year at a budget of 1.5M/yr, or 0.0002 dollars per hour of intense pain averted. Although the specific figures are extremely speculative, they illustrate the leverage possible through this work.