Welfare of Farmed Fish

PRELIMINARY APPRAISAL OF DIFFERENCES IN THE WELFARE OF TOP FARMED FISH SPECIES

The global number of fish confined in farms is estimated to range from 60 to 130 billion individuals at any point in time — roughly the same number of members of our species who have ever been born on planet Earth (since around 200,000 B.C.E). The increasing global appetite for fish and the sharp decline in wild fish populations each year will keep forcing farmed fish numbers up: global production of fish has quadrupled over the past 50 years, with no clear signs of growth stagnation yet.

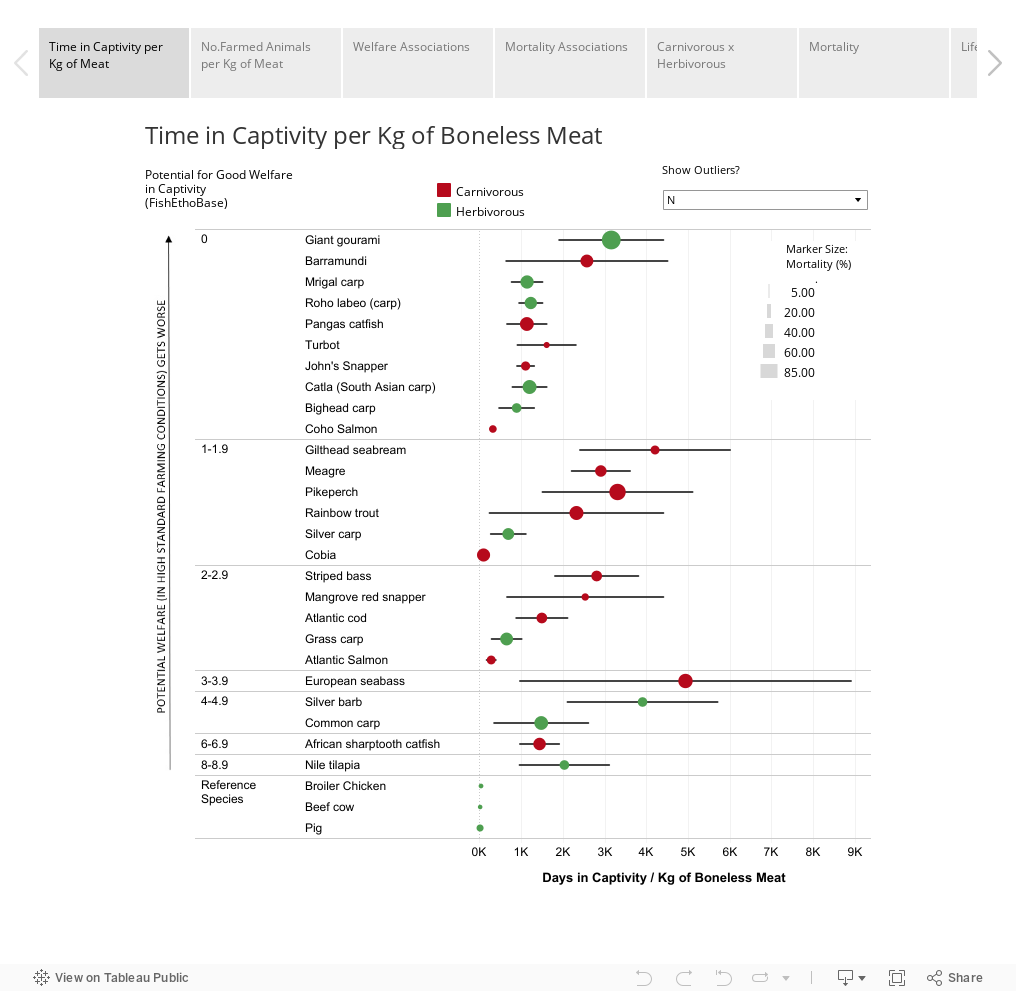
Farmed fish are typically smaller than terrestrial farm animals, and grow at a much slower rate. Accordingly, the time they spend in captivity to produce the same amount of meat, calories or protein is substantially longer. Likewise, the number of farmed fish used to produce a given amount of meat is also larger given their smaller body sizes, higher pre-slaughter mortality rates, and use of other fish species as feed (in carnivorous species). Slaughter is typically conducted without stunning, death is slow and even high-standard farming conditions typically fall very short of enabling the expression of the behavioral repertoire of most species.

This makes fish farming a vastly underrecognized source of suffering among farmed vertebrates. In this preliminary assessment, we explore the possible scope of harm imposed on 25 of the top farmed fish species, and the extent to which some fish species may experience substantially different welfare than others. For each species we estimate  the time in captivity and number of individuals typically killed to produce 1 Kg of boneless fish meat. Estimates are based on brief reviews of typical mortality figures during the fingerling and grow-out stages, life spans in captivity, weight at slaughter and weight conversion factors. We also explore the association of these parameters with (1) scores representing the potential for good welfare under high-standard farming conditions, as developed by the FishEthoGroup (Fair-Fish International) and (2) each species’ dietary habits (predominantly carnivorous or herbivorous).

This preliminary analysis is not based on the Cumulative Pain metric, through which the time in physical and psychological pain (i.e. negative affective states) emerging from every welfare challenge (e.g., diseases, injuries, behavioral deprivations, threats, fear) is quantified and justified. Instead, it is simply aimed at providing an initial and rough approximation of possible differences in the loss of welfare embedded in the production of the top farmed fish species, hence of which fish groups should be prioritized for further investigation.

METHODS

  • Selection of 25 top farmed fish species, based on global production data (FAO), for which information on potential for good welfare (as determined by the species FishEthoScore) was available;
  • Parameters assessed for each species: (1) time in captivity per Kg of boneless meat produced (includes time in captivity of individuals that died before slaughter) and (2) number of fish slaughtered per Kg of boneless meat produced;
  • Compounding factors analysed: (1) estimated slaughter age, (2) weight at slaughter (market size), (3) life span as fingerlings (young fish developed to the point where they have scales and working fins) and in grow-out facilities, (4) mortality as fingerlings and in grow-out facilities;
  • Estimates of mortality and lifespan are based on a brief and limited review of the scarce literature on each species, and may not reflect typical industry values; they reflect our 90% subjective confidence intervals (an excellent explanation of subjective confidence intervals is given by Animal Charity Evaluators, here). The sources for each estimate are available in the interactive charts (tabs Lifespan and Mortality);
  • Estimates of market weight are mostly derived from FishCount, FAO and ACE;
  • Calculations are available at this Guesstimate model;
  • Estimates of the number of fish killed exclude: mortality of brood stock, destruction of fish due to deformities, mortality of larvae and fry (fish developed to the point where they are capable of feeding themselves), mortality during shipping, mortality of fish used as feed, bycatch, mortality of cleaner fish and indirect mortality of wild animals (e.g. from diseases and drug residues released in the water).
  • Welfare scores, developed by the FishEthoGroup – Fair-Fish International, represent the assessment of each species potential for good welfare in captivity based, predominantly, on the extent to which conditions in captivity matches their natural environmental. Ten criteria are evaluated (aggregation, home range, depth range, migration, reproduction, substrate, stress, aggression, malformations and slaughter). Each criteria may receive either a rating (HIGH, MEDIUM or LOW potential for good welfare) or no rating (‘no findings’, ‘unclear’). We only considered species for which at least 5 criteria had a rating. Scores are measured as the sum of criteria scoring HIGH divided by the total number of criteria for which a rating was available.
  • Conversion from live to edible weight considers conversion factors for fillets (conversion varies widely for fresh, headed, gutted, frozen, filleted, and combinations)

INTERACTIVE CHARTS WITH RESULTS

MAIN FINDINGS

  • Among the species investigated, an average of 4 to 10 individuals of the ‘farmed species’ are killed for every Kg of boneless meat; this is 8 to 13 times greater than the number of chickens killed for a Kg of boneless chicken meat (0.5-0.75);
  • On average 3,000 (1,200 to 4,800) days in captivity (sum of days in captivity for all individuals killed), or about 8 years, are required to produce 1 Kg of boneless fish meat. This is ∼120 times longer than the time in captivity needed to produce 1 Kg of boneless chicken meat (∼25 days). Notice, though, that a longer time in captivity does not necessarily translate into greater suffering, as we have shown with broiler chickens (e.g., cumulative time in pain is greater in shorter-lived fast growing broilers than in longer-lived slower-growing breeds). Cumulative pain in farmed fish has yet to be measured.
  • Time in captivity per Kg of edible meat varies widely, more within fish species than between fish and some land animals. For example, Cobia spends 53-120 days in what seems to be very poor welfare (potential for good welfare score: 1.1) for every Kg of boneless meat produced, but producing the same weight from the European perch and yellow catfish (which can potentially enjoy somewhat better welfare: scores of 2.5 and 6, respectively) requires 5,100-42,000 and 5,000-19,000 captive days, respectively.
  • The potential for good welfare in captivity under high-standard farming conditions is very poor (average score: 1.8 out of 10), as measured by the ten criteria in the FishEthoScore. This score, however, is predominantly based on how well farming conditions match the species’ natural environment. On the one hand, individuals may be able to adapt to some artificial conditions without loss of welfare. On the other, the actual effects of the challenges farmed fish endure (e.g., diseases, injuries, poor water quality, starvation, fear, behavioral deprivations) on welfare (i.e. the intensity of the experience’s unpleasantness, its duration) are not considered in this score, nor is their prevalence. Therefore, use of the Cumulative Pain metric should provide more accurate estimates in  follow-up assessments.

Mortality Findings

  • Cumulative mortality varies on average from 11 to 82% from the fingerling until the end of the grow-out stages (market size). This figure is only the tip of the iceberg: it excludes deaths during shipping, culling, brood stock and larvae mortality. It may also exclude removal of moribund fish (which may end up in harvest statistics). It also excludes deaths of fish used as cleaners or as feed, their associated bycatch, and deaths of wild fish from residues and diseases from fish farms.
  • Mean monthly mortality varies from about 0.6 to 6.7% deaths/month among the species investigated, as compared to ∼2.5%, 2.6% and 0.1% deaths/month in broilers, pigs and beef cows, respectively.

Observed differences between predominantly Carnivorous and Herbivorous species

  • No clear differences were observed between predominantly carnivorous and herbivorous species in terms of (1) pre-slaughter mortality, (2) growth rates, and (3) potential welfare to be achieved in captivity under high-standard farming conditions.

the language used to refer to fish is the same as that used for PLANT CROPS

FISH AND OTHER AQUATIC ANIMALS ARE