The Welfare Footprint Institute is a research organization dedicated to an audacious but concrete goal: quantifying animal welfare impacts to inform practice, policy, investing and purchasing decisions.
We quantify welfare using a biologically meaningful, relatable and comparable metric: time in affective states (negative or positive) of different intensities—a metric applicable across farming systems, geographies and species.
We partner with all stakeholders across animal supply chains—academics, producers, policymakers, animal protection organizations, investors and certifiers—. maintaining scientific rigor and independence, and bringing transparency to animal welfare impacts through evidence-based measurement, peer review, and full disclosure of assumptions and uncertainties.
We act as a multiplier of impact, making animal welfare efforts more effective through objective measurement that all stakeholders can rely on.
Mission: To advance the scientific quantification of animal welfare to drive improvements in policy, practice, and ethical decision-making.
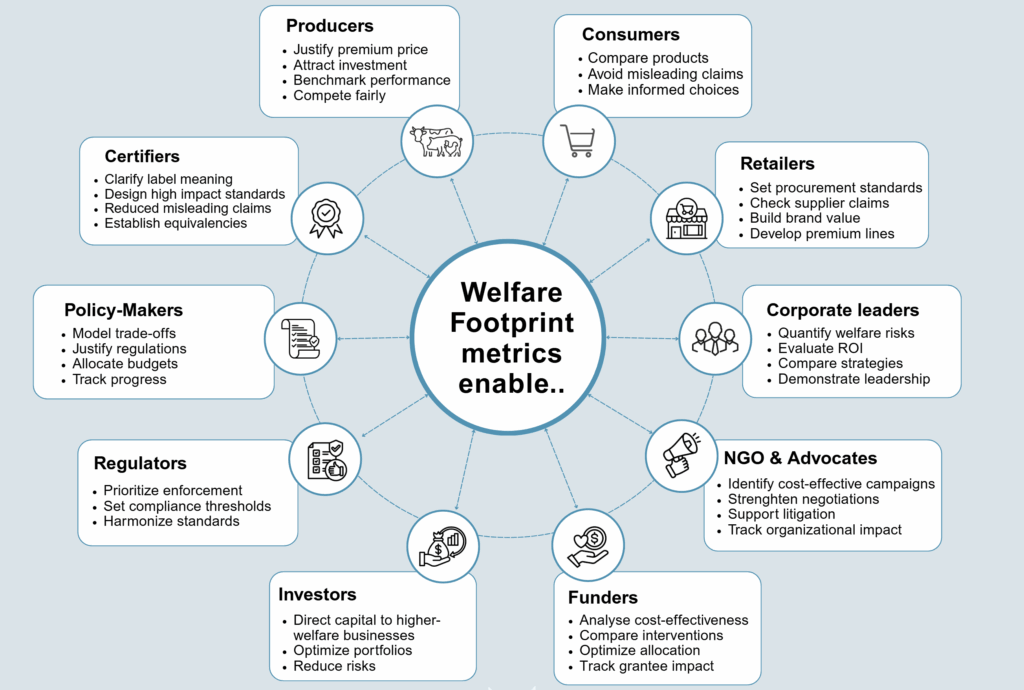
Welfare footprint metrics create positive impact through four mechanisms.
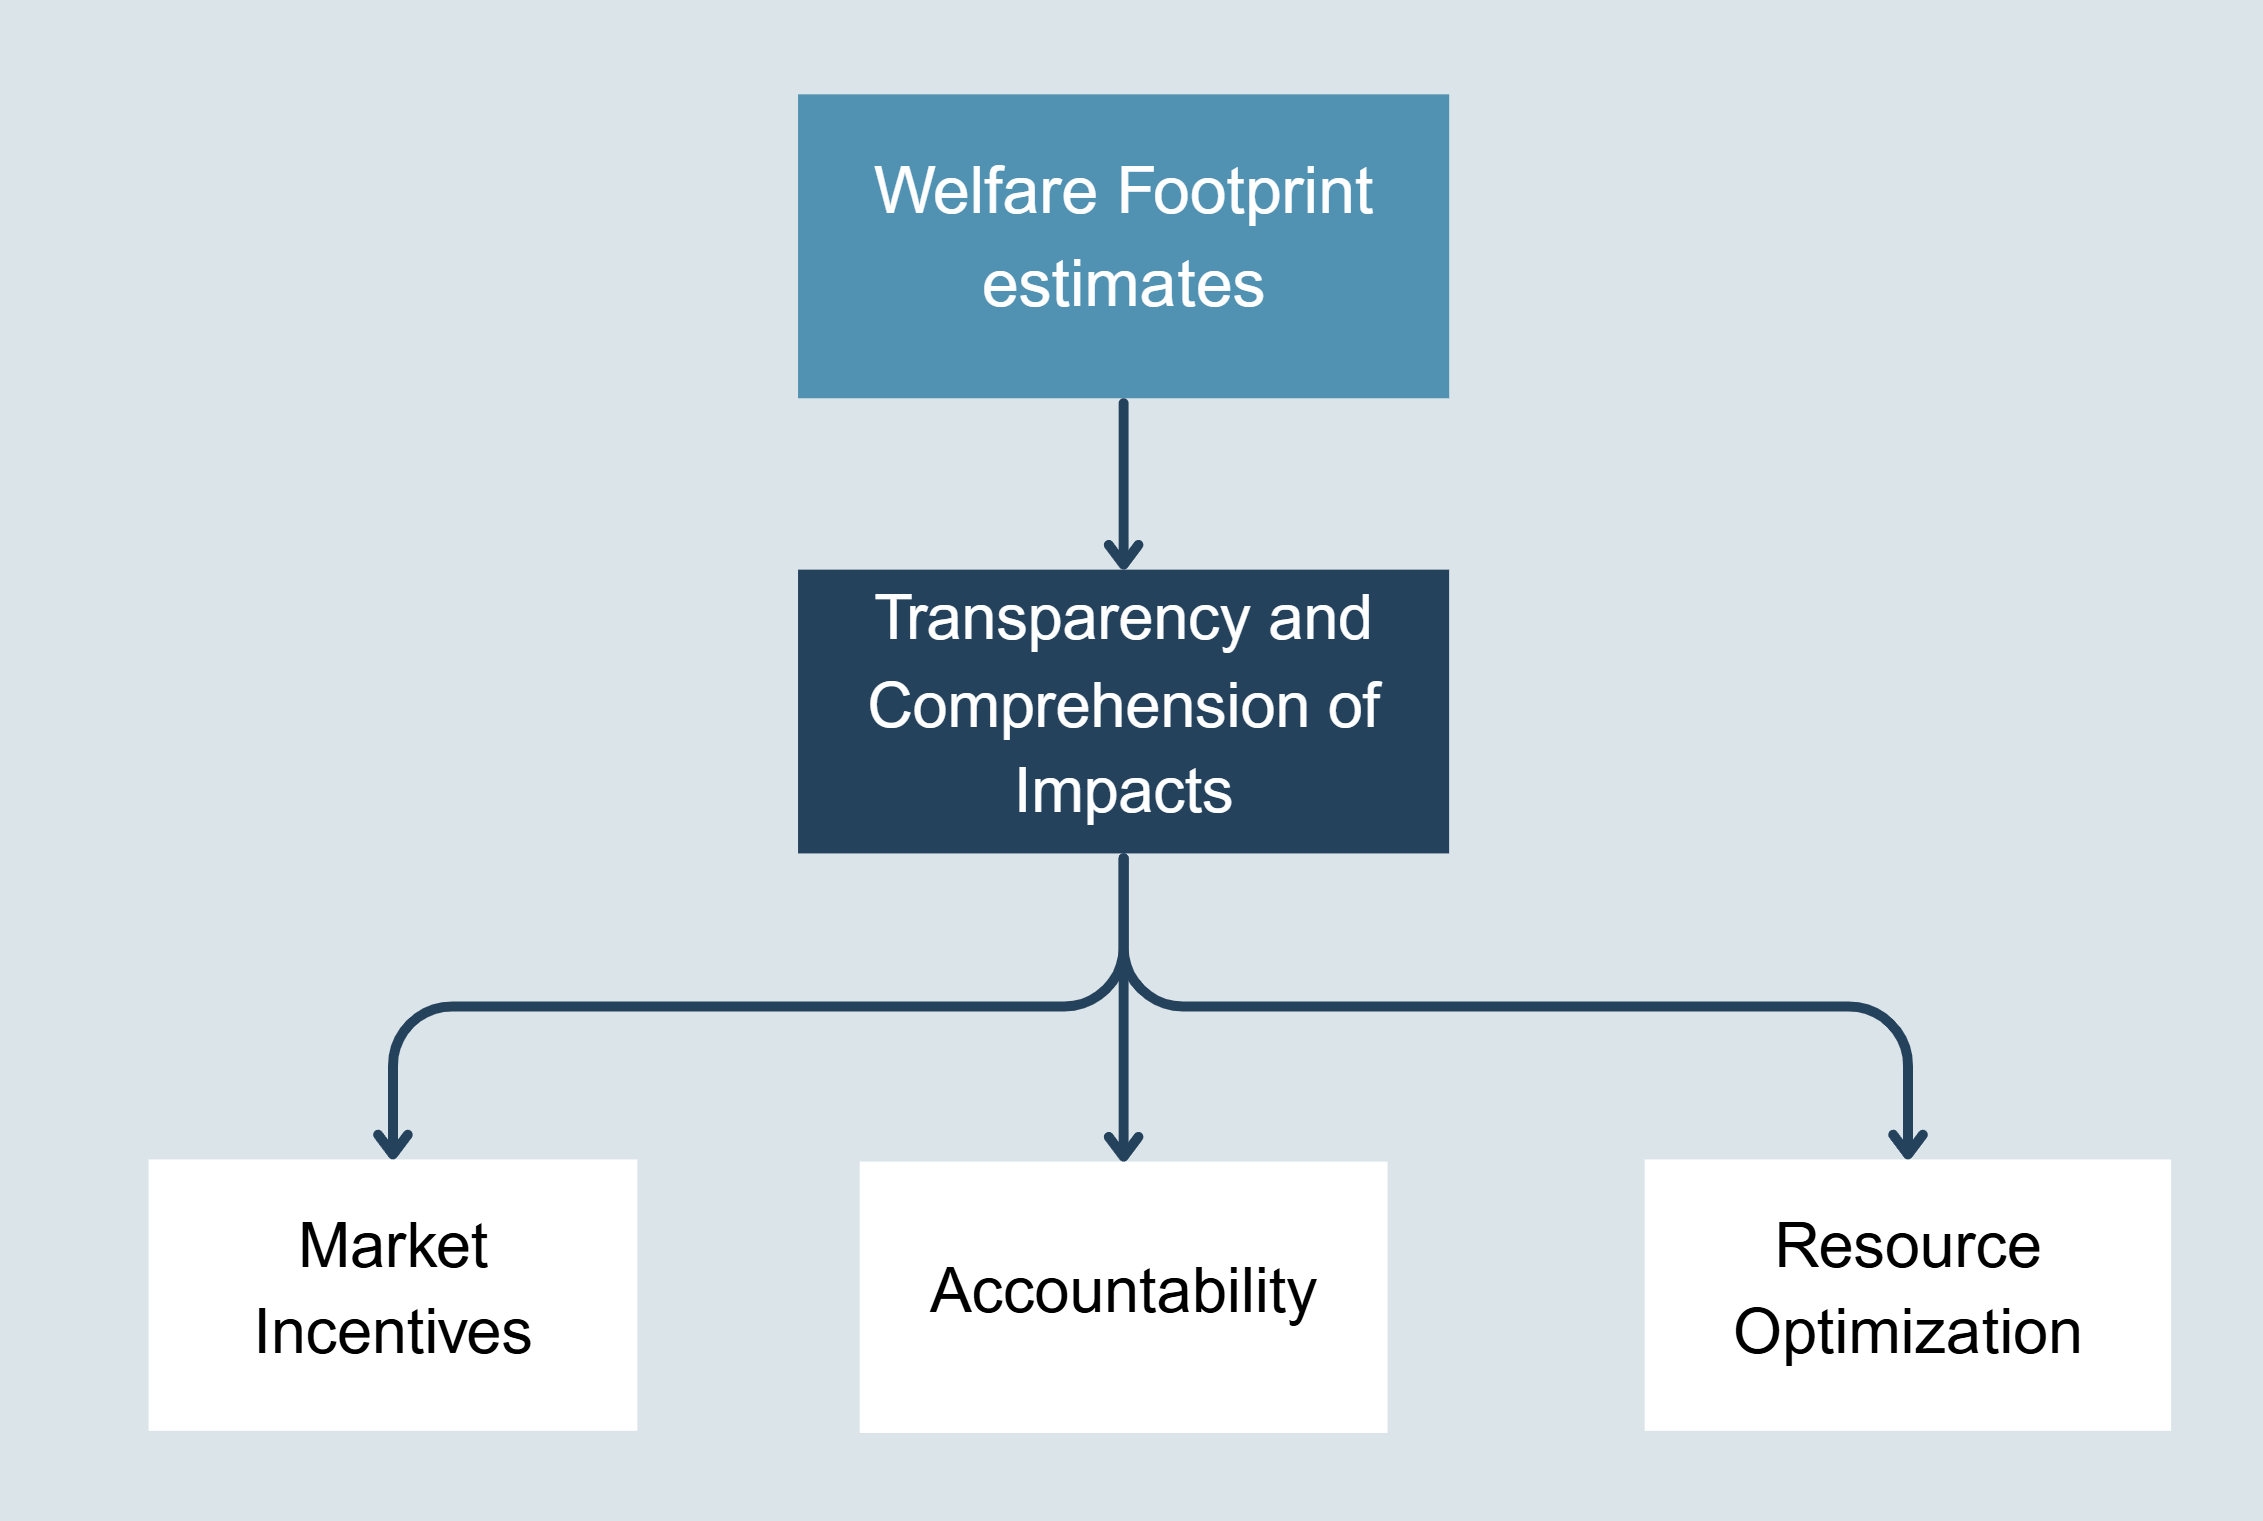
Making animal welfare impacts visible, understandable and measurable. When welfare is quantified in relatable units like "hours of intense pain per Kg or $" stakeholders can finally see and compare the true costs.
Creating incentives that reward true welfare improvements while reducing the power of misleading claims. Producers who invest in welfare can justify premium pricing with concrete evidence.
Enabling verification, monitoring, and evaluation of welfare claims and commitments. Certifiers, retailers, and regulators can verify the extent to which standards actually reduce animal pain and improve welfare.
Directing limited funds, research, and efforts to highest-impact interventions. Organizations can identify which campaigns prevent the most animal pain, or improve welfare the most, per dollar spent.
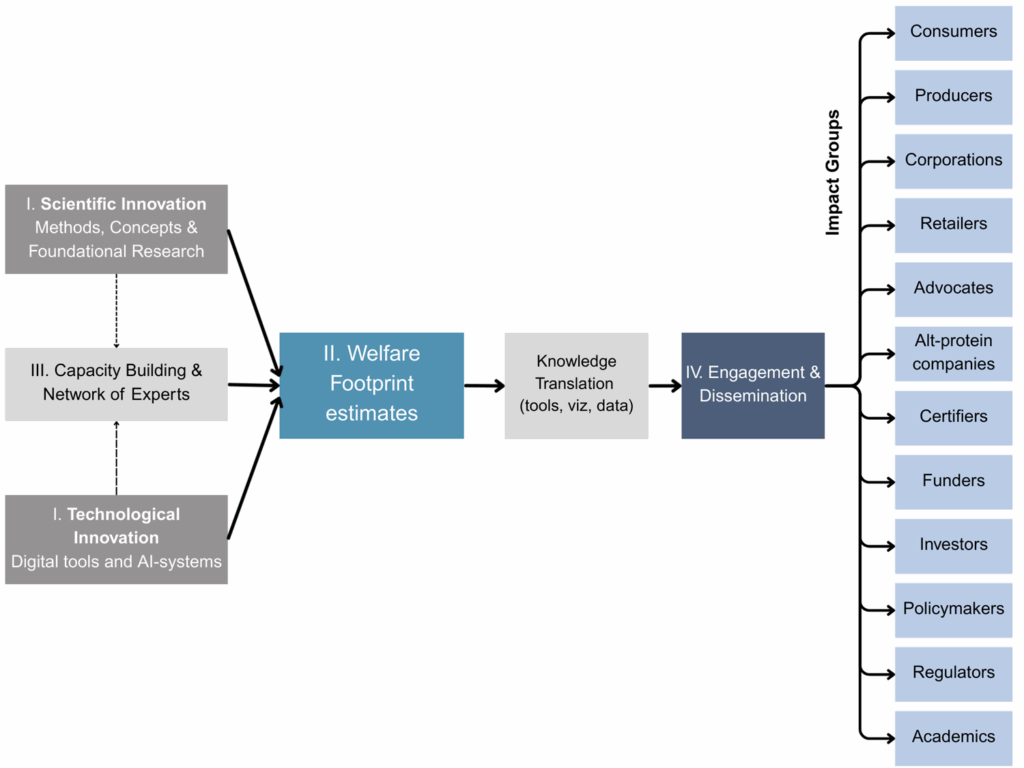
I. Scientific & Tech Innovation
• Development: new concepts & metrics
• Digital & AI tools to accelerate research
II. Applied: Welfare Impact Estimates
• Production of welfare impact estimates
• Identification of effective approaches
• Identification of key research gaps
III. Capacity Building & Network Growth
• Training and certification programs
• Academic partnerships
IV. Engagement & Dissemination
• Partnering with certifiiers and producers
• Tools for policymakers and regulators
• Clear communication for consumers
• Evidence for animal protection NGOs
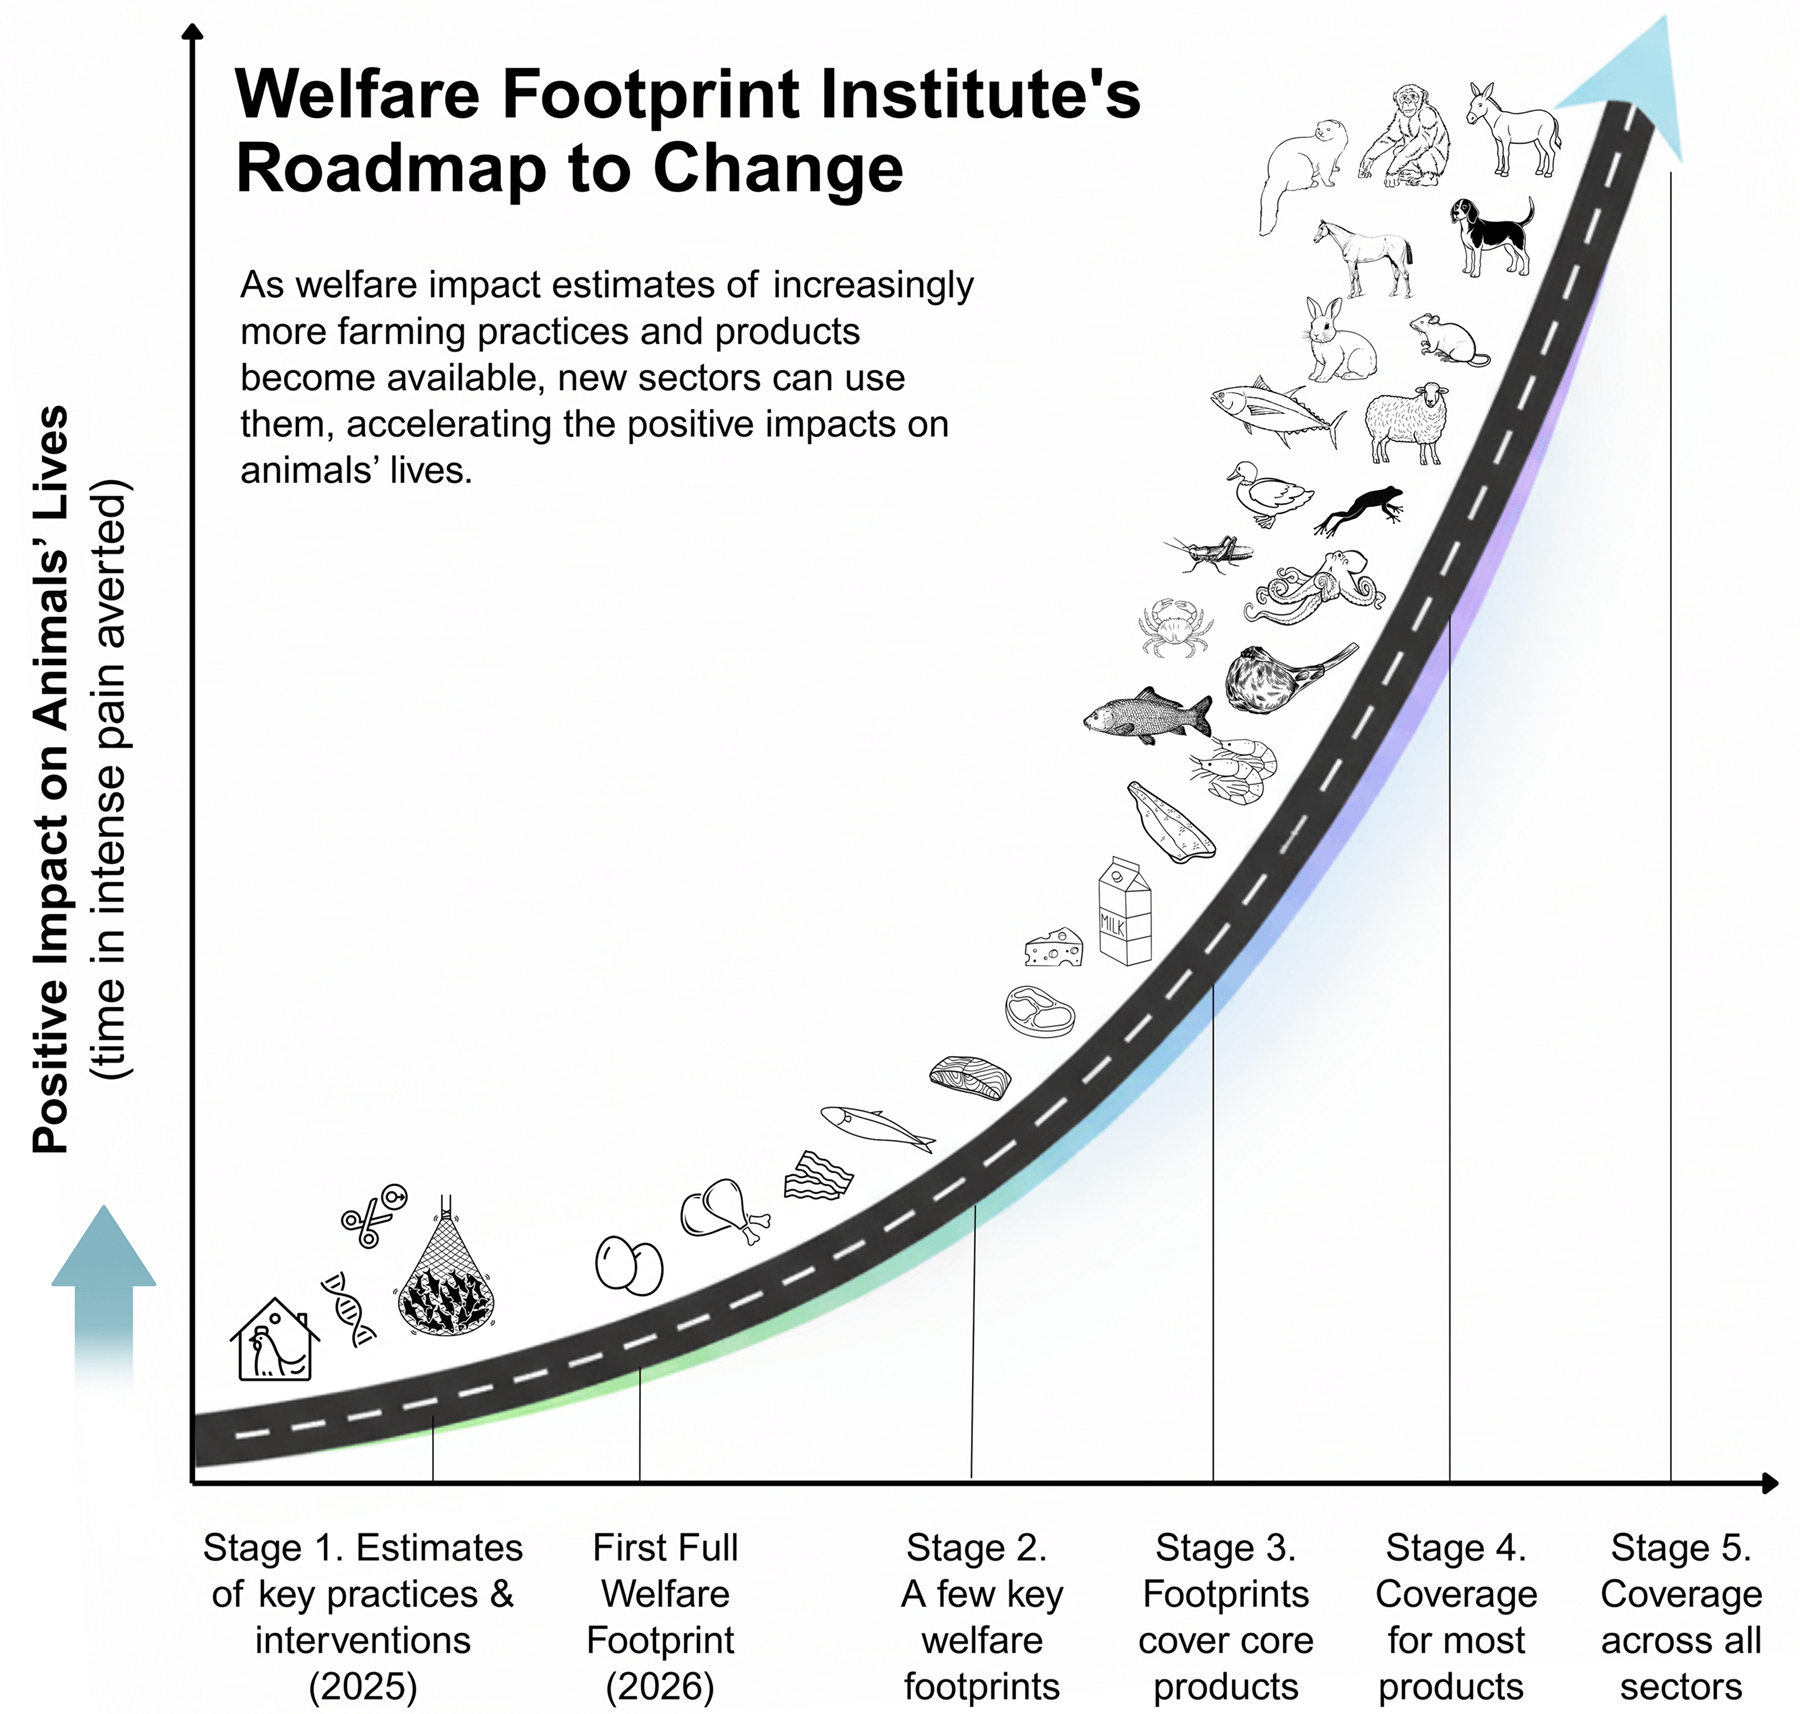
Some changes go beyond incremental improvement, creating ripple effects. Welfare Footprints follow this pattern, enabling animal welfare to be integrated into economic, policy, and consumer decisions in ways that can drive systemic improvements. Importantly, the value of estimates grows disproportionately as their coverage includes a broader range of products and farming practices, by enhancing the comparability of previously existing estimates and unlocking applications in new sectors
The WFI drives improvements in animal welfare by providing quantifiable metrics that enable evidence-based decisions across diverse stakeholders. The cost-effectiveness of WFI’s activities arises, among others, from leveraging existing investments in animal-impacting activities, enabling more effective resource allocation and increasing the likelihood of higher-welfare practices. The impact is vast:
The calculator in the page below estimates the additional impact that welfare research creates in terms of improving animal welfare beyond what would happen without it. By quantifying how credible welfare evidence increases the success rate of reform efforts, we can estimate the magnitude of additional improvements in animal welfare per dollar invested in WFI’s research projects.
Consider the population of over 200 billion farmed vertebrates slaughtered every year, and the potential to improve the lives of, say, 5% of this population (~10 billion animals, mostly broilers and fish) globally (this is based on one of the major global campaigns, the cage-free transition, reaching about 5 to 20% of the global population; we assume campaigns reaching broilers and fish will be relatively less successful). We assume each broiler chicken experiences > 50 hours of intense pain (as previously estimated), and farmed fish live ~20 months in captivity. If only 1% of farmed fish lifespan was in intense pain (a conservative assumption), this would amount to about 100 hours in intense pain per fish (20 months x 30 days x 16 hours/day * 0.01). If by helping design more effective interventions, standards and practices to reduce time suffering, the WFI made welfare interventions just 1% more effective than they would have been otherwise (counterfactual), either by helping reduce more time in pain or increasing the likelihood of implementation, it could help avert an ‘additional’ 8 billion hours in intense pain per year. This represents >5,000 hours in intense pain averted per dollar every year at a budget of 1.5M/yr, or 0.0002 dollars per hour of intense pain averted. Although the specific figures are extremely speculative, they illustrate the leverage possible through this work.