Over the last decades, growing demand for animal-sourced foods, along with rapid changes in production modes, has translated into a massive expansion of the livestock sector. Simultaneously, the industrial processes behind animal food production have become increasingly complex and diverse. Nowadays, the description of processes and procedures typically associated with different animal production systems presents challenges of technical nature to specialists and educators, and of understanding to laypersons. Production systems can vary widely depending on legislation, enforcement, consumer demand, market requirements, and regional tradition. Differences may be present in terms of the breeds used, stocking densities, the type and size of enclosures, the provision of enrichment, the timing and length of the production phases, veterinary interventions, and other factors. Even farms using similar housing systems possess differences in their physical structure and management strategies, which will lead to differences in productivity, environmental impact, and animal welfare outcomes.
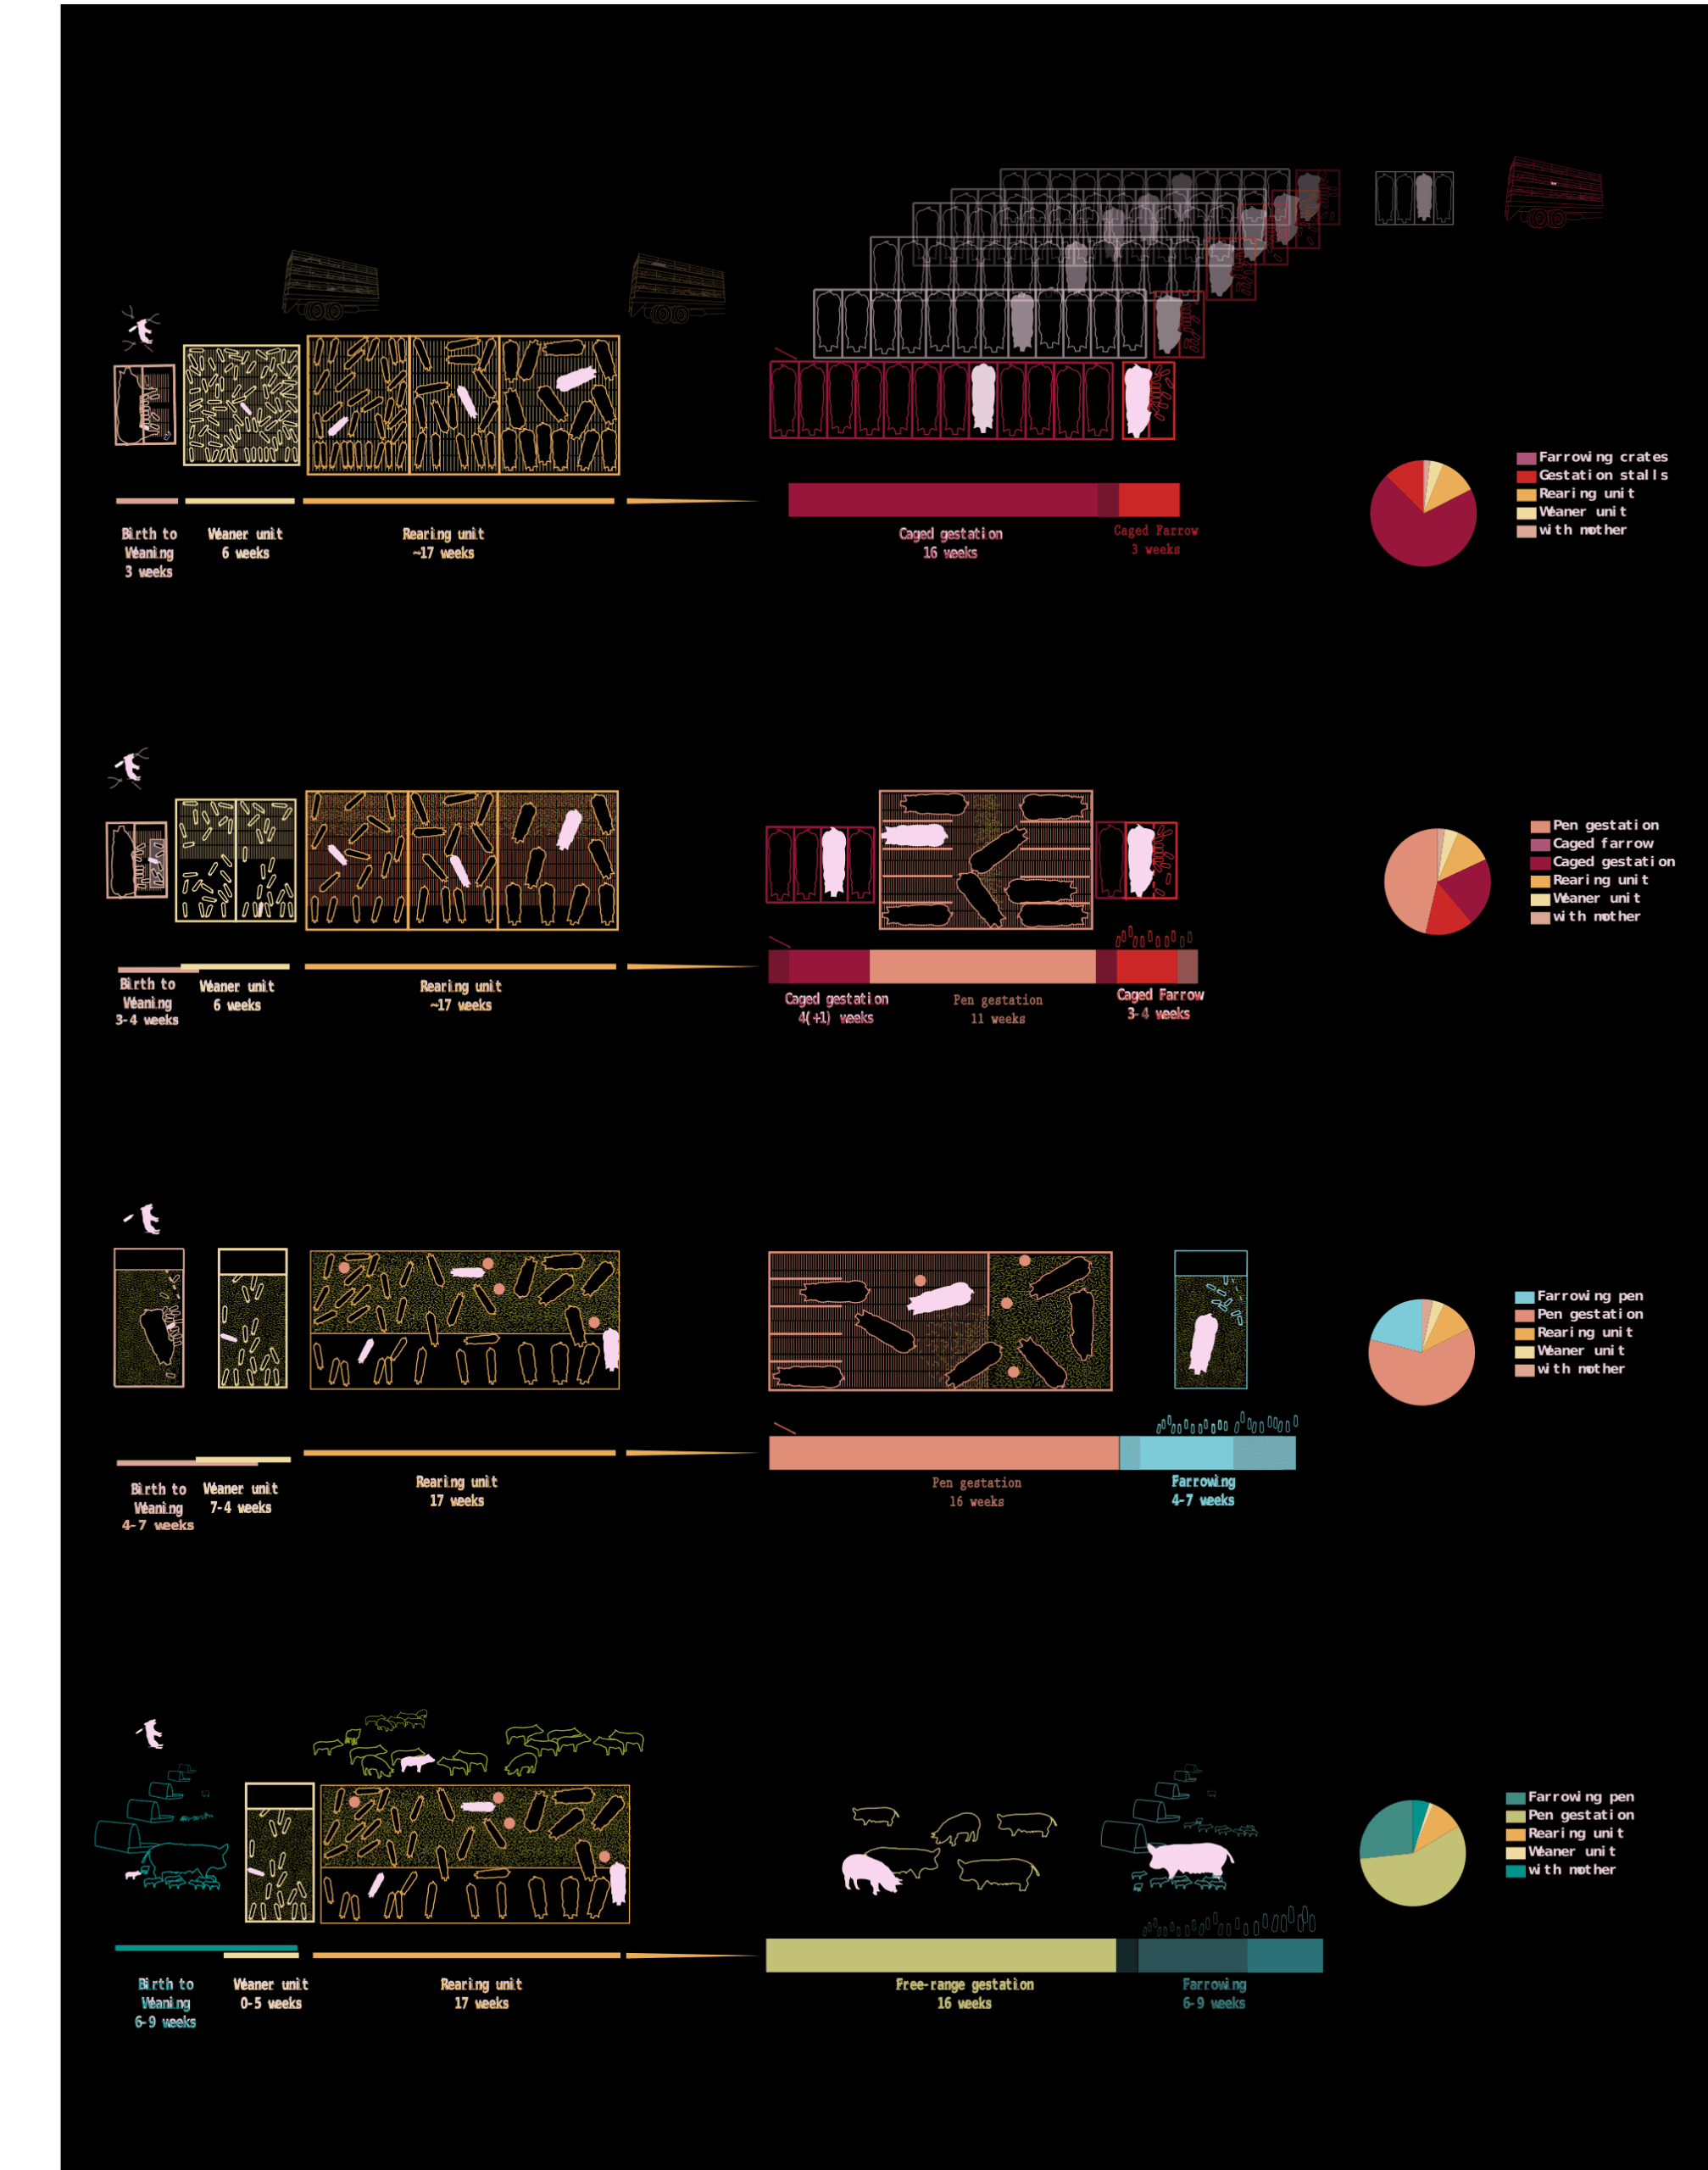
No technique has yet been developed to convey information about common, relevant processes involved in animal production, enabling their understanding for didactic, quantitative and comparative purposes. To address this shortcoming, we developed a visualization solution which we refer to as a ‘Processogram’. A Processogram is a process diagram that depicts the spatial and temporal configuration of the production chain, focusing on the physical and social environments to which animals are exposed during each phase of their lives.
Processograms convey a time-ordered description of lifecycles and production phases within animal production systems. In addition, they incorporate veterinary and zootechnical information pertaining to each system, particularly those with a well-established effect on animal health and welfare.
In a processogram, the proportions of spatial components of the system represent real-life conditions, and are fitted along a horizontal axis that represents the passage of time (production phases or biological cycles). The use of spatially and temporally consistent elements allows users to visualize the production process over time and compare attributes of alternative production systems in a streamlined format, where the welfare impacts of different practices and conditions can be easily visualized.
Because of the temporal organization of the processogram, we can also use it as a reference layer upon which additional sublayers of time-indexed information (e.g. temporal dynamics of disease incidence and other welfare-related indicators) can be overlaid, helping us to identify causal links between specific hazards and their welfare consequences. Composite diagrams can be created by combining, in a time-orderly way, input data from veterinary, zootechnical and management domains. In its digital format, users can obtain further information about any element by selecting it to reveal additional sublayers of information. By enabling a better understanding of the living and management conditions experienced by animals in different production scenarios, processograms provide a useful interactive visualization tool to help guide consumers’ and policy-makers’ decisions concerning animal health and welfare. Processograms also support analytical approaches that require the investigation of farm animal life cycles, including the development of animal welfare footprints.
In their interactive digital version – soon to be launched – Processograms will allow users to explore and compare systems at their own pace and at a level of detail appropriate to their personal interests and background.