Can AI power the Global Mapping and Quantification of Animal Suffering? The Pain Atlas Project

Can AI power the Global Mapping and Quantification of Animal Suffering? the Welfare Footprint Atlas Project
Wladimir J Alonso, Cynthia Schuck-Paim
Demis Hassabis is one of the key figures behind many technological advancements in AI. In his TED talk “How AI Is Unlocking the Secrets of Nature”, he illustrates a groundbreaking achievement where AI saved an estimated one billion year’s worth of research hours in molecular biology. Traditionally, solving the three-dimensional structure of a protein takes a PhD student 4-5 years, but with AI this could be done in minutes. In just one year, the AI-based AlphaFold project described the structure of the 200 million known proteins, which will greatly contribute to advance our understanding and treatment of many diseases. The capabilities of AI have the potential to revolutionize other scientific fields too, at a pace that is difficult to comprehend.
We propose that one such field is the large-scale mapping and quantification of animal suffering — and that the analytical tools required for this task are not only available, but can now be structured into a scalable, inspectable system.
Recruiting AI to help quantify animal suffering
AlphaFold used AI by training a deep learning model on a vast dataset of known protein structures and their corresponding amino acid sequences, enabling it to predict new structures from new sequences. To quantify (negative or positive) affective experiences, we depart from a very different reality, since there is not yet any method that enables directly accessing subjective affective states. Therefore, different from proteins, there is no dataset of known correspondences that can be used by deep learning models.
However, a method to estimate the key elements of affective experiences – duration and intensity – has been recently made available through the development of the Welfare Footprint Framework (WFF). Over the last few years, the Welfare Footprint Framework (WFF) has been used to estimate the welfare impact of animal welfare reforms and interventions in different species. Although originally developed for use by researchers, the WFF is particularly suitable for structured implementation in AI-assisted workflows. However, the role of AI in this process is not to replace scientific reasoning, but to accelerate structured analysis within a framework where assumptions, evidence, and intermediate steps remain explicit, inspectable, and open to revision.
One particularly critical part of this process, where the WFF made its major contribution, is in the description and quantification of affective states. This is explained in more detail elsewhere, but in short, the method for describing negative experiences is performed with the Pain-Track (Fig. 2) and follows two basic stages:
Breaking Down the Experience: because the intensity of most experiences fluctuates over time (e.g., it may increase as a disease advances, or reduce as healing progresses), each experience is divided into meaningful time segments, each representing an expected intensity pattern. For example, the pain from stubbing a toe starts with sharp, immediate pain lasting seconds, followed by acute pain with swelling, lasting minutes. This continues through secondary pain and bruising (minutes to hours), subacute pain and healing (hours to days), and mild residual pain during recovery. This approach can be applied to any unpleasant experience, such as disease, injury, fear, frustration, or hunger.
Estimating Intensity and Duration during each Segment: for each temporal segment, the intensity of the negative experience is estimated, ranging from Annoying to Excruciating. To transform scattered knowledge from various fields into estimates within each cell in the Pain-Track, the WFF uses a structured approach that documents existing evidence and highlights how well it supports or contradicts each intensity hypothesis. For example, to estimate the intensity of pain a make piglet endures during surgical castration, a procedure whereby piglets are restrained, the scrotum incised with a scalpel, and the testes extracted by tearing the tissues or severing the spermatic cord, the experience is first divided into meaningful time segments. Next, all relevant information is gathered from the literature. This includes, among others, data on nociceptor densities in this tissue, the animal’s behavior, posture and vocalizations during and after the process, neurological and physiological responses, the characterization and typical duration of inflammatory processes, the type and dose of analgesics required to alleviate pain, and the evolutionary significance of pain for the animal and in the area affected. Each of these lines of evidence is then compared with the definitions of the four categories of pain intensity used in the WFF to estimate the intensity and duration of the experience in each of these specific moments. Once estimates of the intensity and duration of the experience are made for each time segment of a Pain-Track, calculating welfare loss, measured as Cumulative Time in Pain of different intensities (or Cumulative Pain for short), is straightforward and automatic.
Since discovering the powerful capabilities of LLMs to gather and interpret large volumes of data, we have been exploring their potential, particularly in creating Pain-Tracks. One outcome of this exploration is the development of tools such as the ‘Hedonic-Track’ Custom GPT. These tools serve as structured analytical sandboxes, allowing users to explore how different components of the WFF — such as temporal segmentation of experiences, evidence synthesis, and intensity estimation — can be operationalized step by step. These systems are not final analytical engines, but intermediate tools that help test workflows, refine assumptions, and identify the requirements for a more integrated and scalable infrastructure.
https://youtu.be/Bhf_ICByeNw
Video demonstrating how the Hedonic-Track Custom GPT (former ‘Pain-Track Custom GPT’) operates at the time of this writing, using the welfare impact of air asphyxia in fish (trout) as an example.
From the moment the tool has started to perform satisfactorily, our priority has been to make it available to the research and advocacy community, even if they are not yet perfect. We found it particularly useful for didactic purposes, incorporating it into our workshops as a way to engage participants in the understanding and use of the Welfare Footprint method. Participants are motivated by being able to immediately describe and quantify sources of suffering in their target species or even for their personal pain experiences.
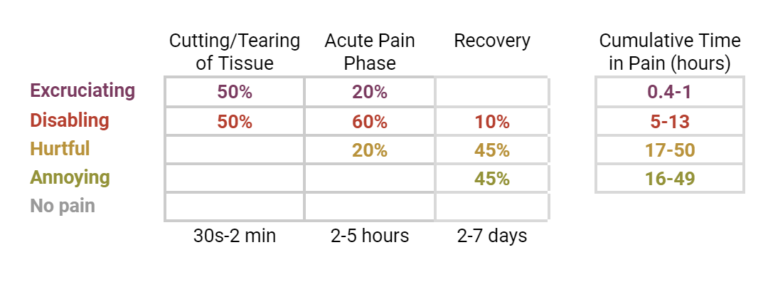
While the results of the tool should only be interpreted as a starting point of analysis, which still requires human revision, estimates of Cumulative Pain produced so far are promising. For example, except for Annoying pain, estimates of Cumulative Pain due to surgical castration in male piglets produced by the Hedonic-Track Custom GPT tool fall within the credibility interval of estimates developed by researchers, as shown below:
Still, LLMs are not deterministic, so estimates vary across queries. In the example above, 3 out of 10 individual estimates of Excruciating pain, and 5 (out of 10) individual estimates of Disabling pain did not overlap with those produced by the researchers, despite being in the same ‘ballpark’. Therefore, if the outputs of this GPT tool are aimed at informing decision-making, we advise using the average of about 10 queries, in the same way that human-based estimates are typically the consensus of various researchers.
The welfare footprint ATLAS PROJECT
Identifying and understanding the sources of suffering (mainly in its extreme forms) in humans and animals under our custody are arguably among the most morally important research endeavors we can embark on.
Given that the technological conditions are ripe, as we have shown throughout this text, we initially proposed the Pain Atlas Project as a way to systematically map and quantify sources of suffering across species. As this work has evolved, it has become clear that this effort should be understood more broadly as part of a larger objective: the development of a Welfare Footprint Atlas — a structured, scalable, and inspectable system for quantifying both negative and positive affective experiences across animal products, production systems, and species.
This effort is no longer best understood as a project composed of a few components, but as the development of a structured analytical system, organized in layers that allow welfare information to be generated, validated, and progressively integrated across species and systems.
1. Structured Knowledge Layer (WFKG)
A schema-governed backbone where all analytical elements — from circumstances to affective states and welfare metrics — are represented in structured, interoperable form.
2. Analytical Layer (WFF modules)
The application of the Welfare Footprint Framework across its modules (Circumstances → Biological Consequences → Affective Experiences → Quantification), allowing structured and comparable analysis.
3. AI and Workflow Layer
AI-assisted processes for extracting evidence, structuring analyses, generating first-pass estimates, and supporting validation — always within explicit and inspectable constraints.
4. Output and Visualization Layer
The transformation of structured outputs into visual, comparative, and interactive representations that make welfare impacts understandable and actionable.
We invite everyone to provide feedback in the EA forum and discuss potential collaborations (feel free to also reach out to us at AI@welfarefootprint.org).